New ACE/MAG Data Product to Aid in the Search for Waves
PDF version

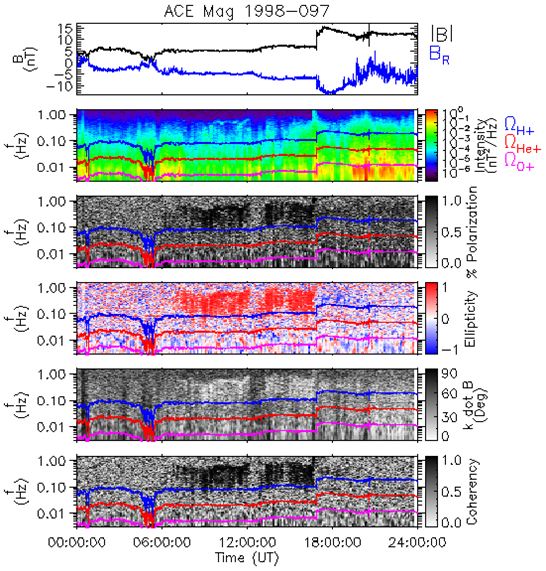
The ACE/MAG team has just released a new data product in the form of daily spectrograms which is proving to be extremely useful in finding shocks and various wave signatures. The figure shows an example of that product. The top panel shows the total (black) and radial (blue) magnetic field. The rest of the panels show the results of a polarization analysis: wave intensity, percent polarization, ellipticity, arccos(k·B), and coherency. Ellipticity is positive for right-handed waves and negative for left-handed waves, while k and B represent unit vectors in the direction of wave propagation and mean magnetic field, respectively.
The imaginary part of the covariance matrix of the magnetic field contains information only about circularly polarized signals [Means, 1972]. From this, we can determine the components of k and transform into the wave normal system, with k along Z and B in the XZ-plane. In this system, the plane wave power is contained in the transverse plane, allowing us to separate the unpolarized and polarized components [Rakin and Kurtz, 1970; Fowler, et. al, 1967]. Wave polarization properties are then solved for in terms of the components of the covariance matrix.
The figure shows the spectrogram for April 7, 1998 (DOY 97). A shock is evident at ~17:00 UT. The shock itself is not remarkable. It is likely a quasi-perpendicular shock, but the unavailability of SWEPAM data at this time renders a more exact analysis questionable. What is remarkable is the extent of the ion foreshock as represented by upstream wave activity that starts ~07:00 UT and persists until the shock crossing. The spectrogram shows a strongly polarized signal at frequencies greater than the proton cyclotron frequency. They are highly coherent, right-handed, nearly circular ellipticity with field-aligned minimum variance directions (fluctuations transverse to the local mean magnetic field) as expected of waves excited by protons upstream of the interplanetary shock.
An earlier, but exhaustive, analysis did reveal the extent of these waves far from the shock, but the availability of this spectrogram makes such an analysis much easier and faster for the researcher.
This item was contributed by Matthew R. Argall and Charles W. Smith Of the University of New Hampshire on behalf of the ACE Team. Address questions and comments to
ACE News Archives
Subscribe to ACE News
ACE Homepage
Last modified 12 March 2015.